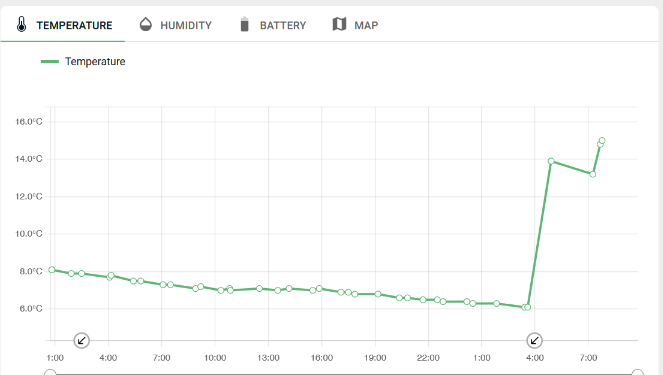
In the Tec4Cloud graph, only the highest and lowest measurement values are presented to enhance loading speed. For those seeking a more thorough analysis of the data collected, a detailed report can be downloaded directly from the device in either PDF or Excel format. This comprehensive report includes all raw data recorded within the specified interval.
Temperature graph view in the Tec4Cloud:
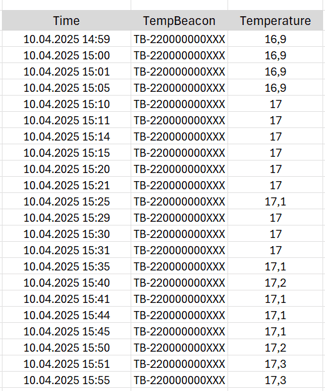
In comparison with the raw data as a csv file: